June 2022
Visualize Metrics
You can now plot metrics in AskAnna!
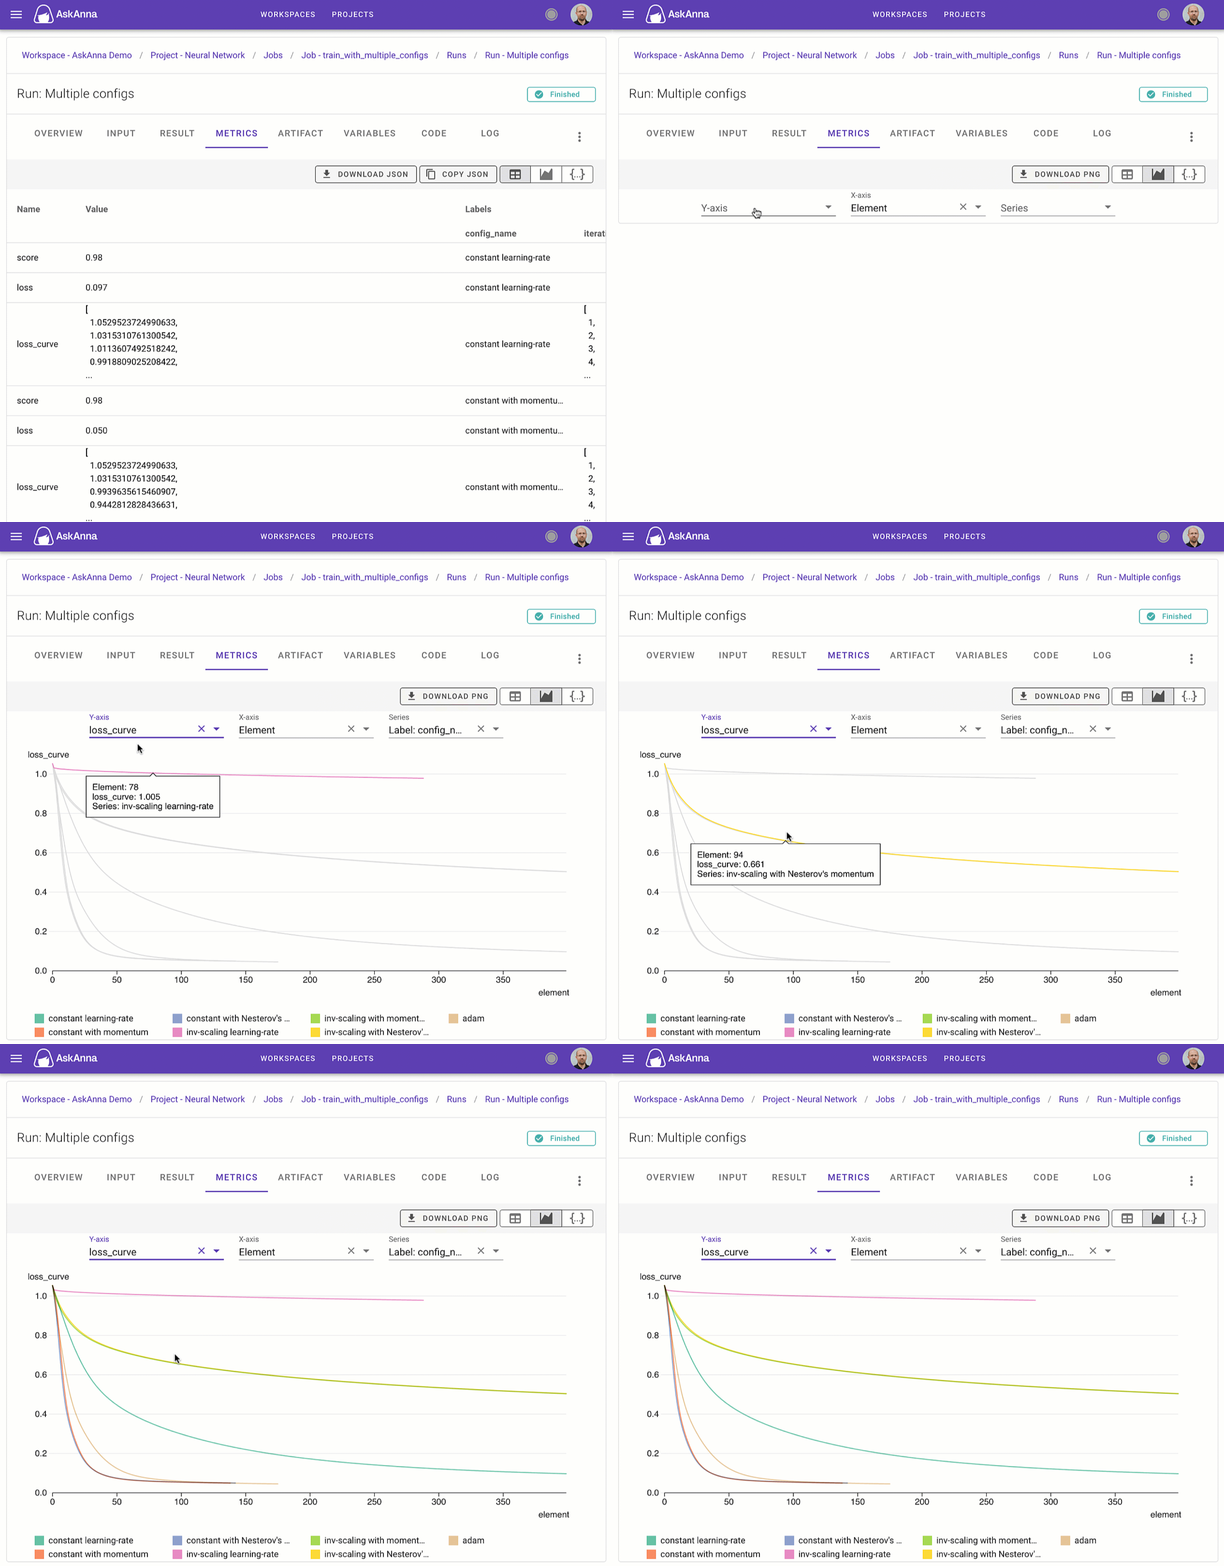
For example, if you’re working on machine learning models you might want to see the learning curve to monitor your model’s learning performance. With this update, you can do this directly in the AskAnna interface. You don’t need to create a graph of the tracked metrics yourself.

On the run metrics section, you can select the “visualize” icon and select what you want to see. Want to share it? Copy the URL in your browser, or download an image file of the graph.